solution
The Student’s t-test
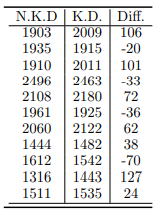
The famous t-test was initially illustrated by “Student” in a paper published in 1908 (available at: http://biomet.oxfordjournals.org/ cgi/reprint/6/1/1). In the paper, Student used several examples to illustrate the process. One example (Illustration 3) discussed the yield of barley of seeding plots with two different kinds of seed. Each type of seed (kiln-dried and not kiln-dried) was planted in adjacent plots in two different years, accounting for 11 pairs of “split” plots. The data listed below are from the table on page 24 of the 1908 paper.

The statistical method used in Student (1908) is very different from the ones we use now. On page 24, Student concluded that the odds that kiln-dried seeds have a higher yield is 14:1. Conduct the t-test using the “head corn” yield data shown above. Can you guess where the 14:1 odds come from?
"Looking for a Similar Assignment? Get Expert Help at an Amazing Discount!"


