solution
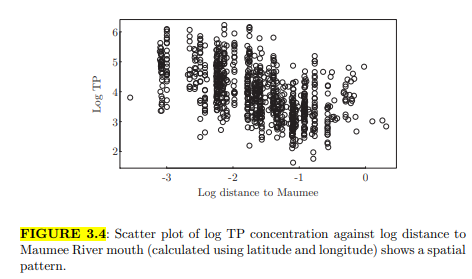
Many institutions around Lake Erie have long-term water quality monitoring programs. These institutions, however, use several different water sampling methods and several chemical analytical methods for measuring water quality variables. The data file Eriecombined.csv include monitoring data from six institutions collected from 2010 to 2013. Figure 3.4 shows data from NOAA. One way to examine institutional differences is to use a multilevel model with institution as a factor variable, after other factors affecting water quality (TP and chlorophyll a concentrations in particular) are accounted for. These factors include (1) distance to the source of phosphorus (the Maumee River), (2) year, and (3) season (months).
(a) Use exploratory data analysis tools (e.g., Q-Q plots) to determine the nature of the difference (e.g., multiplicative or additive differences). Based on the exploratory analysis, recommend an appropriate transformation for the two water quality variables of interest (TP and chlorophyll a concentrations).
(b) Fit multilevel models for TP and chlorophyll a concentrations (TP and CHLA, respectively), using distance to Maumee River mouth (DISTANCE) as a continuous predictor and INSTITUTION, YEAR, and SEASON as three factor variables. Describe model outputs in plain language.
(c) Present the differences among institutions graphically.
Figure 3.4

"Looking for a Similar Assignment? Get Expert Help at an Amazing Discount!"


