solution
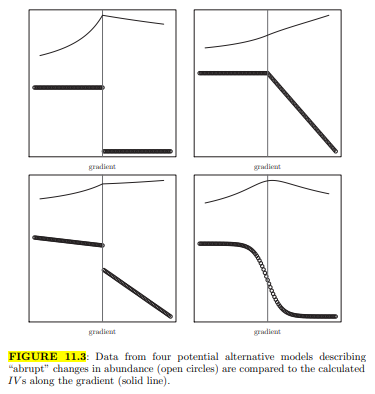
In evaluating TITAN we used several alternative models to show the pattern of the IV s along an environmental gradient. Another natural pattern discussed by Cuffney and Qian [2013] is the Gaussian response model, where the response curve is similar to a bell-shaped curve. This response pattern is often used to represent the ââ¬Åsubsidy-stressââ¬Â response of a taxon. The initial increase in a pollutant (e.g., nutrient) provides subsidy to the growth of the organism, but the organism is stressed after the pollutant exceeds a threshold. The response pattern can be expressed as a parabola function of the gradient in log-abundance scale:
![]()
where y is the taxon abundance and x is the environmental gradient. A logical threshold is the peak of the quadratic curve. Draw the response curve of IV similar to the curves in Figure 11.3 and discuss whether TITAN is appropriate for this type of threshold response.
Figure 11.3

"Looking for a Similar Assignment? Get Expert Help at an Amazing Discount!"


