solution
Regression analysis is often used as a tool for causal inference. A typical application of regression analysis for casual inference will fit a model using the outcome as the response variable and the potential cause(s) as the predictor(s). Because of the inevitable confounding factors in a typical social science study, the regression model will inevitably include other predictors to account for the variability associated with different conditions. Including confounding factors in a regression model is often called controlling in social science. It is this controlling that often leads to the misuse of regression analysis. For example, Kanazawa and Vandermassen [2005] suggested that parent’s occupation can predict the likelihood of having boys or girls. Particularly, if the parent’s occupation is “systematizing” (e.g., engineering), she/he tends to have more boys, and if the parent’s occupation is “empathizing” (e.g., nursing), he/she tends to have more girls. The conclusion was reached by using a regression analysis to the University of Chicago’s General Social Survey data. When studying a parent’s likelihood of having boys, the article used a regression model of the form:
![]()
That is, number of boys is predicted by parent’s occupation after controlling the number of girls (opposite sex children), plus other predictors (such as income) (Table 1 of Kanazawa and Vandermassen [2005]). The theory was illustrated using the model because the slope for engineer is positive and statistically different from 0. In a letter to editor, Gelman [2007] pointed out that this result may be a statistical artifact, and proposed a simulation.
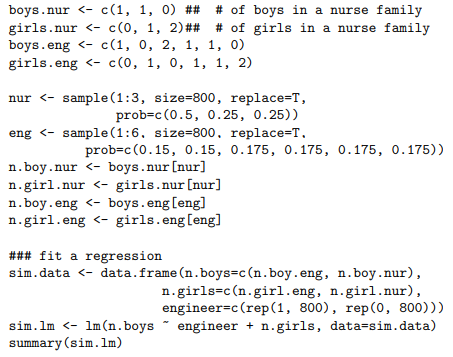
The simulation creates two groups of families (nurses and engineers) of families, each having one or two children. Collectively, child sex ratios of the two groups of families are both one boy to one girl. The difference between a nurse family and an engineer family is how they decide the number of children: nurses will stop at having one child if the first born is a boy, and two children otherwise; engineers will stop at one child with probability 30% and continue on to a second child with probability 70%, regardless of the sex of the first child. In this simulated data, the probability of a boy is exactly 50% for all births; thus the true effect, the difference in sex ratios between engineer and nurse families, is actually zero. Under this simulated model, nurses will have the following distribution of family types: 50% boy, 25% girl-boy, 25% girl-girl. Engineers will have the distribution: 15% boy, 15% girl, 17.5% boy-boy, 17.5% boy-girl, 17.5% girl-boy, 17.5% girl-girl. Use the following scripts to generate 800 families of engineers and 800 families of nurses and fit the regression model:

Is the model result in conflict with the data? Any thoughts on why this would happen (hint: think about the meaning of the slope of engineer)?
"Looking for a Similar Assignment? Get Expert Help at an Amazing Discount!"


